
Take control of your IT

The costliest gap in IT is not knowing what you have. The Integrated Performance Map (IPM) shows the strengths, weak spots and responsibilities of your IT landscape at a glance. Decisions rest on facts rather than assumptions, and investment goes where it makes a difference.

Silhouettes of two people on a film set in blue haze01

Assumptions

Decisions based on guesswork.

No one can reliably say where action is urgently needed — or which areas already work excellently.


Stage lights shining through thick haze02

Budget fog

Budget spent everywhere. Priorities unclear.

Projects without relevant value get funded, while real opportunities go unnoticed.
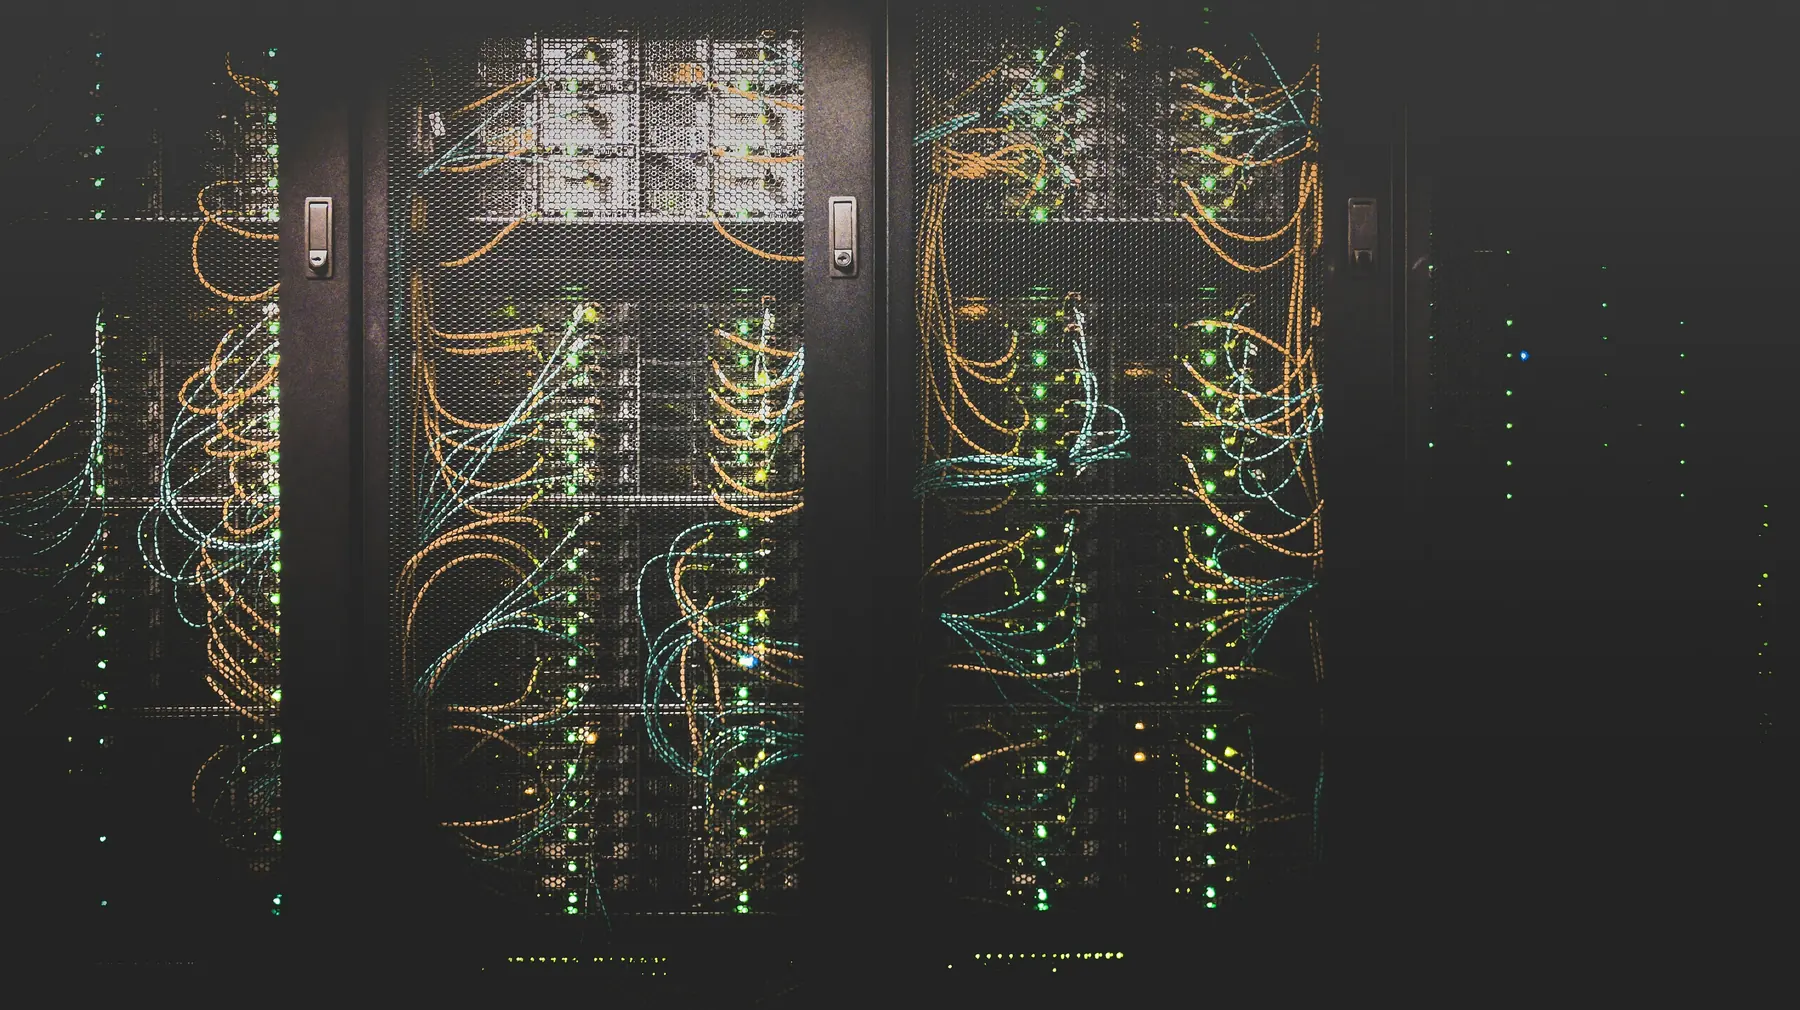
Server racks with densely routed cables in a dark equipment room03

Engine room

The digital engine room stays dark.

Where the technological strengths lie, where weaknesses lurk and who is responsible — nobody knows exactly.

Where you stand

If you don’t know your IT landscape, you make hazy decisions — and often only spot opportunities as they disappear over the horizon.

Many companies don’t know their IT landscape in enough detail. They don’t know exactly where the technological strengths lie, where weaknesses lurk and who actually bears responsibility for critical topics.

The consequences reach across the business: decisions are often made on the basis of assumptions rather than facts. The resulting vacuum is a breeding ground for speculation, because no one can reliably say where action is urgently needed. At the same time, it remains unclear which areas already work excellently and need no further attention. Investments are therefore often spread thinly without clear priorities: projects that create no relevant value get funded, while potential problem areas and real opportunities go unnoticed.

The necessary transparency in the digital engine room is missing. And that has a direct effect on the entire organisation. From IT architecture through production processes and financial management to strategic workforce planning.

What is it costing you?

CorInnoHiveMAP replaces assumptions about your IT landscape with a clear basis for leadership decisions, targeted investment and lasting competitiveness.

Without CorInnoHiveMAP

  • What it costs you: Investments may flow into projects that create little or no business value.
  • What it costs you: Poor strategic and technical decisions become more likely because the factual basis is missing.
  • What it costs you: IT and business functions work side by side instead of together. That strains the value chain and increases frustration in the organisation.
  • What it costs you: Business goals are lost from sight because initiatives don’t consistently contribute to the strategic agenda.
  • What it costs you: Your reputation and capacity to innovate suffer. Instead of helping to shape the market, you end up chasing it.
  • What it costs you: Decisions follow intuition more often than evidence, increasing the risk of undesirable developments.

So the decisive question is not whether transparency is necessary, but how long a company can afford to act without it.

With CorInnoHiveMAP

  • What you gain: Transparency — Creates the transparency needed to derive well-founded, targeted recommendations for action.
  • What you gain: Focus — Focuses investment on initiatives with real added value instead of projects with an unclear effect.
  • What you gain: Pace — Accelerates and optimises the digital transformation through clear priorities and well-founded decision-making.
  • What you gain: Direction — Shows the way from the status quo to the IT of the future and makes development potential visible.
  • What you gain: Orientation — Gives management, IT and business functions a shared understanding of where they stand.
  • What you gain: Steering — Turns a clear picture into better decisions, and better decisions into competitive advantage.

Transparency is far more than a technical reporting instrument.

How we solve it

With the CorInnoHiveMAP methodology, the state of your IT isn’t debated at length, but made visible quickly. Strengths, weaknesses and priorities are clearly identified and presented.

  • Structured interviews with those responsible for each business area create a reliable evidence base.
  • Systematic evaluation and assessment of the results makes connections, risks and potential transparent.
  • Visualisation as a radar chart delivers a precise picture of the IT landscape at a glance.
  • Strengths, weaknesses and priorities become clearly visible and create a sound basis for decisions and investment.
  • Individual opinions become shared insights. Complexity becomes a clear picture.
Person speaking into a microphone at a table beside a laptop
The right questions create clarity

If you can’t measure your IT, you can’t steer it effectively either.

Strategy begins where wild speculation ends. Let’s shed light together on the areas that are still in the shadows today.